Building multi-Region visualizations with Highcharts in Amazon Quick
AWS Machine Learning has published a guide on constructing multi-Region carrier performance dashboards within Quick Sight by utilizing Highcharts custom visualizations. This approach allows users to bypass native chart limitations while preserving data sovereignty across distinct AWS Regions. Unified dashboards are achieved through the federated dataset capability of Quick Sight alongside production-ready chart configurations.
Key Takeaways
- A recent publication from AWS Machine Learning details a method for constructing multi-Region carrier performance dashboards in Quick Sight.
By integrating Highcharts custom visualizations, developers can overcome native chart limitations to display complex performance metrics.
- The technical guide presents production-ready chart configurations designed to handle enterprise data rendering demands efficiently.
Maintaining data sovereignty across different AWS Regions remains a crucial requirement for global deployments.
- The outlined approach leverages the federated dataset capability of Quick Sight, allowing organizations to maintain unified visualizations without compromising regional compliance or security standards.
For those building analytical architectures, understanding how to integrate custom visualization tools with federated datasets offers a practical path toward scalable reporting.
- Highcharts custom visualizations can be integrated into Quick Sight to bypass standard chart limitations.
The solution enables multi-Region carrier performance dashboards while preserving data sovereignty across AWS Regions.
- Production-ready chart configurations provided in the guide address security, compliance, and scalability needs.
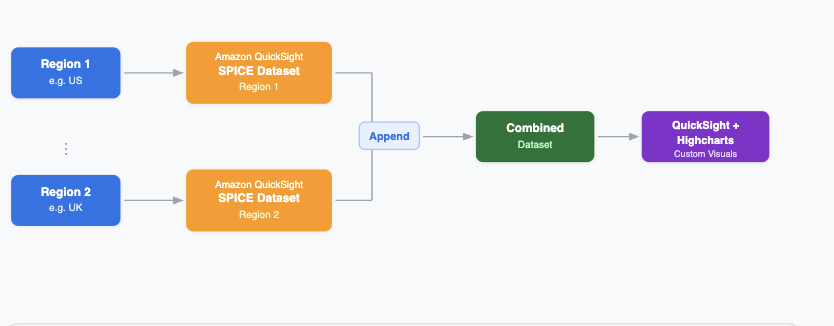
A recent publication from AWS Machine Learning details a method for constructing multi-Region carrier performance dashboards in Quick Sight. By integrating Highcharts custom visualizations, developers can overcome native chart limitations to display complex performance metrics. The technical guide presents production-ready chart configurations designed to handle enterprise data rendering demands efficiently.
Maintaining data sovereignty across different AWS Regions remains a crucial requirement for global deployments. The outlined approach leverages the federated dataset capability of Quick Sight, allowing organizations to maintain unified visualizations without compromising regional compliance or security standards. For those building analytical architectures, understanding how to integrate custom visualization tools with federated datasets offers a practical path toward scalable reporting.
Highcharts custom visualizations can be integrated into Quick Sight to bypass standard chart limitations. The solution enables multi-Region carrier performance dashboards while preserving data sovereignty across AWS Regions. Quick Sight federated dataset capabilities allow organizations to generate unified visualizations across multiple locations.
For more details please read the original article at AWS Machine Learning.
Continue Learning
Comments
Comments appear only after moderation. Your email identifies your submission to the moderator and is never displayed here.
No approved comments yet.