Monitor and debug generative AI inference with SageMaker detailed metrics and Insights dashboard on CloudWatch
Amazon SageMaker now offers detailed metrics and a CloudWatch Insights dashboard to monitor and debug generative AI inference workloads in real time. The enhanced observability supports both single-model endpoints and inference component endpoints, helping teams track performance, identify bottlenecks, and optimize resource allocation for production AI services.
Key Takeaways
- SageMaker provides fully managed real-time inference hosting with automatic provisioning and scaling of compute instances.
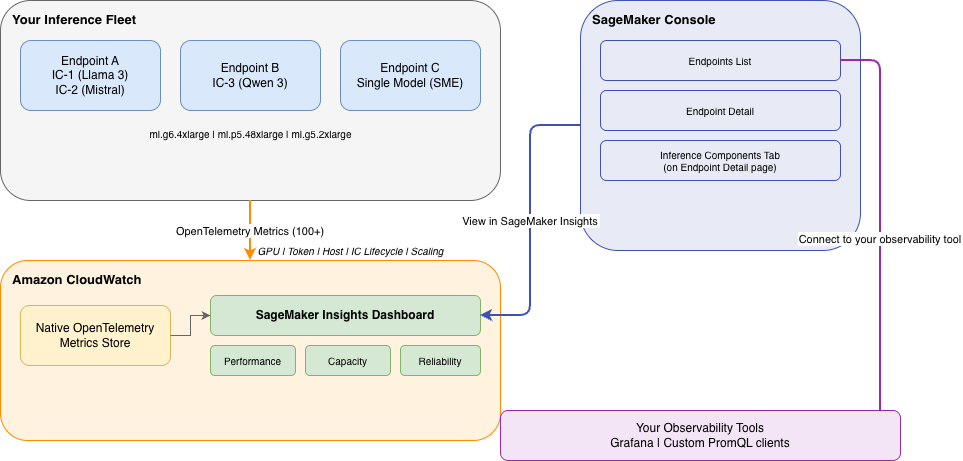
- Two endpoint architectures are available for generative AI: single-model endpoints (SME) and inference component (IC) endpoints, each with distinct observability features.
- Detailed metrics and CloudWatch Insights dashboards enable teams to monitor inference performance and debug issues in production environments.
- Enhanced observability helps identify performance bottlenecks and optimize resource utilization across generative AI workloads.
SageMaker Real-Time Inference Fundamentals
Amazon SageMaker simplifies the deployment and management of machine learning models in production environments.
- ›SageMaker endpoints are fully managed services that handle infrastructure provisioning automatically.
- ›Compute instances are provisioned and scaled transparently without manual intervention.
- ›Multiple endpoint architectures are supported to accommodate different workload patterns and requirements.
- ›Real-time inference capabilities enable low-latency model predictions for production applications.
Amazon SageMaker AI provides a complete infrastructure for deploying machine learning models to production. When you deploy a model to a SageMaker endpoint, the service manages all underlying compute resources, including instance provisioning, health monitoring, and auto-scaling policies. This removes the operational burden of managing servers and allows teams to focus on model development and optimization.
The platform supports diverse machine learning workloads by offering multiple deployment options. Organizations can choose the endpoint architecture that best fits their specific requirements, whether they need simplicity with single-model deployments or flexibility with multiple models on shared infrastructure.
Endpoint Architectures for Generative AI
SageMaker offers two primary endpoint configurations optimized for generative AI inference at scale.
- ›Single-model endpoints (SME) dedicate all resources to a single model, providing straightforward deployment and monitoring.
- ›Inference component (IC) endpoints allow multiple models to share underlying compute instances efficiently.
- ›IC endpoints offer greater flexibility and resource utilization for complex inference scenarios.
- ›Both architectures integrate with CloudWatch for comprehensive monitoring and observability.
Single-model endpoints provide the simplest deployment option for generative AI models. With SME, all allocated compute resources are dedicated exclusively to serving a single model, making resource allocation and performance tracking straightforward. This architecture works well for teams deploying large models that require dedicated hardware or models with consistent traffic patterns.
Inference component endpoints represent a more advanced architecture that enables efficient multi-model serving on shared infrastructure. This design allows organizations to deploy multiple models on the same set of compute instances, reducing costs and improving resource utilization. IC endpoints are particularly valuable for scenarios where multiple smaller models need to coexist or where inference traffic is distributed across several models with varying load patterns.
Both endpoint types support detailed observability through Amazon CloudWatch, enabling teams to monitor performance metrics, track resource utilization, and identify optimization opportunities in real time.
Detailed Metrics and Observability
SageMaker's enhanced metrics provide granular visibility into inference performance and system behavior.
- ›Detailed metrics capture request latency, throughput, error rates, and resource utilization across endpoints.
- ›Metrics are available for both individual models and aggregate endpoint performance.
- ›CloudWatch integration enables custom dashboards tailored to specific monitoring needs.
- ›Historical metric data supports trend analysis and capacity planning for future workloads.
The detailed metrics capability in SageMaker provides unprecedented visibility into inference workload behavior. Metrics capture comprehensive performance indicators including request latency (both end-to-end and component-level), throughput measured in requests per second, error rates and error types, GPU memory utilization, CPU usage, and network I/O patterns. This granular data enables operators to understand exactly how their generative AI models are performing under production load.
The metrics are available at multiple aggregation levels, from individual model performance within an inference component endpoint to aggregate statistics across the entire endpoint. This flexibility allows different teams to focus on the metrics most relevant to their roles: data scientists might focus on model-specific latency and accuracy metrics, while infrastructure teams might monitor resource utilization and scaling events.
Integration with Amazon CloudWatch enables teams to create custom dashboards that combine SageMaker metrics with other AWS service metrics for holistic infrastructure monitoring. Teams can set up alarms based on metric thresholds to trigger automated remediation or notify operations teams when performance deviates from expected ranges.
CloudWatch Insights Dashboard for AI Inference
The specialized CloudWatch Insights dashboard provides an integrated view of generative AI inference health and performance.
- ›The dashboard visualizes key performance indicators specific to generative AI workloads.
- ›Pre-built widgets display common metrics without requiring custom query development.
- ›Insights functionality supports advanced log analysis and pattern detection across inference logs.
- ›Dashboard data refreshes in real time, enabling proactive issue detection and response.
The CloudWatch Insights dashboard is purpose-built to help teams understand and optimize generative AI inference performance. It presents curated views of the most critical metrics for AI workloads, surfacing insights that might be difficult to extract from raw metric streams. The dashboard includes visualizations for latency percentiles, throughput trends, error rates by type, resource utilization patterns, and endpoint scaling activity.
Beyond standard metric visualization, the dashboard leverages CloudWatch Insights' powerful log analysis capabilities to help teams debug inference issues. Teams can analyze inference logs to identify patterns associated with performance degradation, error conditions, or unexpected behavior. This advanced analytics capability transforms raw log data into actionable insights without requiring teams to learn custom query languages.
The real-time refresh rate of the dashboard enables operators to monitor ongoing inference activity and respond quickly to emerging issues. Combined with CloudWatch alarms and SNS notifications, the dashboard becomes part of a comprehensive monitoring and alerting strategy for production generative AI services.
Debugging and Troubleshooting Inference Issues
Detailed metrics and dashboard insights enable systematic debugging of generative AI inference problems.
- ›Latency metrics help identify whether performance issues stem from model inference, data loading, or infrastructure.
- ›Error metrics and logs reveal failure patterns and enable root-cause analysis of inference errors.
- ›Resource utilization metrics help detect capacity constraints or inefficient resource allocation.
- ›Comparative analysis across time periods and model versions helps isolate the source of performance changes.
When inference performance degrades, detailed metrics and logs provide the diagnostic information necessary for rapid problem resolution. Latency breakdowns help teams determine whether slowdowns are caused by the model inference itself, data preprocessing, output post-processing, or infrastructure limitations. This level of detail eliminates guesswork and guides remediation efforts toward the actual bottleneck.
Error tracking and analysis capabilities help teams understand failure modes and prevent recurrence. By examining error rates alongside other metrics, teams can correlate errors with specific input patterns, model versions, or infrastructure conditions. This analysis often reveals opportunities for model improvements or infrastructure adjustments that enhance overall reliability.
Optimization and Capacity Planning
Observability insights support continuous optimization and informed capacity planning decisions.
- ›Historical metrics reveal usage patterns and help predict future capacity requirements.
- ›Resource utilization data guides decisions about instance type selection and endpoint sizing.
- ›Latency trends inform optimization priorities and help track improvements from tuning efforts.
- ›Cost analysis becomes possible when metrics are correlated with infrastructure spending.
The metrics and insights available through SageMaker monitoring enable data-driven optimization of generative AI inference infrastructure. Teams can analyze historical patterns to identify peak load periods, characterize typical inference workload profiles, and make informed decisions about instance types and endpoint configuration. This analysis helps organizations right-size their infrastructure to balance performance requirements with cost efficiency.
Over time, collected metrics provide the foundation for trend analysis and capacity forecasting. Teams can project future capacity needs based on observed growth patterns and make proactive infrastructure changes before performance degradation occurs. This approach minimizes service disruptions while avoiding overprovisioning.
Frequently Asked Questions
What is the difference between single-model endpoints and inference component endpoints?
Single-model endpoints (SME) dedicate all compute resources to serving a single model, offering simplicity and straightforward monitoring. Inference component (IC) endpoints allow multiple models to share underlying compute instances, providing greater flexibility and resource efficiency for complex scenarios with multiple models or varying traffic patterns.
How does the CloudWatch Insights dashboard help with debugging inference issues?
The dashboard provides real-time visualization of key performance indicators, latency breakdowns, error rates, and resource utilization. It leverages CloudWatch Insights' log analysis capabilities to identify patterns associated with performance problems, enabling teams to diagnose and resolve issues quickly without manual log parsing.
What metrics are available for monitoring generative AI inference?
SageMaker provides detailed metrics including request latency (end-to-end and component-level), throughput, error rates and types, GPU memory utilization, CPU usage, and network I/O. Metrics are available at multiple aggregation levels, from individual model performance to aggregate endpoint statistics.
How can observability metrics support capacity planning?
Historical metrics reveal usage patterns, peak load periods, and resource utilization trends. Teams can analyze this data to predict future capacity needs, select appropriate instance types, and make proactive infrastructure changes before performance degradation occurs, balancing performance with cost efficiency.
Enhanced observability in SageMaker empowers teams to deploy, monitor, and optimize generative AI inference with confidence and efficiency.
Continue Learning
Comments
Sign in to join the conversation